
This article is transferred from WeChat public account Wang Zhiyu
as the mainstream choice of high-performance storage, SSD capacity is also continuously breaking the limit. To meet this demand, the storage industry is actively promoting the application of higher-density NAND flash memory technology, of which QLC technology has attracted much attention due to its higher storage density. However, QLC technology not only brings capacity leap, but also brings performance, durability, service level agreement (SLA) and other challenges. Understanding these challenges and exploring corresponding solutions are essential to give full play to the potential of high-capacity SSDs. This article will discuss in depth the technical features and challenges of high-capacity QLC SSD, as well as the industry's efforts to meet these challenges, especially large size (LBS) how can innovative technologies affect the future storage structure.
-
understand the technical driving force behind the development of high-capacity SSD and its inherent challenges. -
Recognize the differences between QLC SSD and TLC SSD in terms of performance and reliability, and the specific performance of these differences under different workloads. -
Understanding storage system performance is an end-to-end concept. Factors such as network, cache, and software are as important as SSD itself. -
Learn how cutting-edge technologies such as large size (LBS) can be seen as the key to solving future high-density SSD availability challenges.


The picture shows the development trend of SSD capacity.
The chart clearly shows that SSD capacity has been increasing significantly through an upward curve and labeling of different capacity points (from 32GB to 256TB), and this growth trend is expected to continue. Different capacity points show different types of SSD products, reflecting the evolution of technology.
technologies to support SSD capacity growth
-
increase the number of digits in the L2P table: by increasing the number of digits for each entry in the logical (L2P) table, you can directly expand the maximum capacity supported by the SSD. For example, increasing the capacity from 32 bits to 34 bits can increase the maximum capacity to 64TB. -
Sub-drive technology: the storage space of an SSD is divided into multiple smaller logical units (sub-drives). Each sub-drive has its own L2P mapping table, so as to achieve finer wear Balance and Management. -
Increase IU page size: increase the size of indirect Unit (IU), for example, increase from 4KiB to 8KiB, which can reduce the DRAM capacity required by L2P table, however, read-modify-write (RMW) operations may be introduced to affect the performance of small I/O requests.
Problems faced by SSD capacity growth
-
DRAM cost and performance: increasing the L2P table number and IU size will consume more DRAM resources and may introduce additional complexity and latency. -
Wear balance challenge: Although sub-driver technology contributes to local wear balance, global wear balance between sub-drivers is still a challenge. -
Compatibility and complexity: increasing IU size may affect the compatibility of old systems and increase the complexity of firmware and hardware design.

The picture lists several key factors that affect the overall performance of the storage system.
These factors include the processing capability of the host (server), the cache or buffer memory used by the system, the bandwidth of the network connection, the overhead and potential limitations of the software itself, and the processing capability of the storage controller or system, and the performance of the final storage device (such as SSD). The system architecture diagram in the figure also vividly shows how these different components are related to each other, which jointly determines the performance of the storage system.

it is emphasized that network bandwidth is one of the key factors affecting the performance of the storage system, and it may be the bottleneck of the system.
It is clearly pointed out that the network speeds of 25 Gbps and 100 Gbps are becoming and are expected to dominate in the near future.
The bar chart (server port speed evolution) in the figure shows the change trend of market share of different network speeds from 2020 to 2025, confirming the growth and dominant position of 25 Gbps and 100 Gbps.

five possible misunderstandings or discussion points About QLC (four-tier unit) SSD performance are listed.
-
With the development of technology, whether the core speed of QLC can catch up with TLC (three-layer unit); -
whether faster interfaces (such as PCIe Gen5 and Gen6) can improve QLC performance; -
the impact of advances in NAND interface technology (such as Toggle 5.0, SCA) on QLC; -
whether powerful master control chips and high-end DRAM can improve QLC performance; -
and whether the SSD performance will increase as the capacity increases.

The picture illustrates the voltage distribution characteristics of different types of NAND flash memories (SLC, MLC, TLC, QLC) through diagrams.
The chart shows that as the number of bits stored in each unit increases (from 1 bit in SLC to 4 bits in QLC), the number of voltage levels required increases exponentially (from 2 to 16). This means the "distance" or voltage difference between adjacent voltage levels is significantly reduced, and the voltage distribution curve for each state becomes narrower. The text in the picture particularly emphasizes that the voltage distribution of QLC is narrower and the distance between adjacent levels is shorter, which implies that the complexity of reading and writing data increases., and compared with low bit/unit technology, it may face greater challenges in noise tolerance and durability.
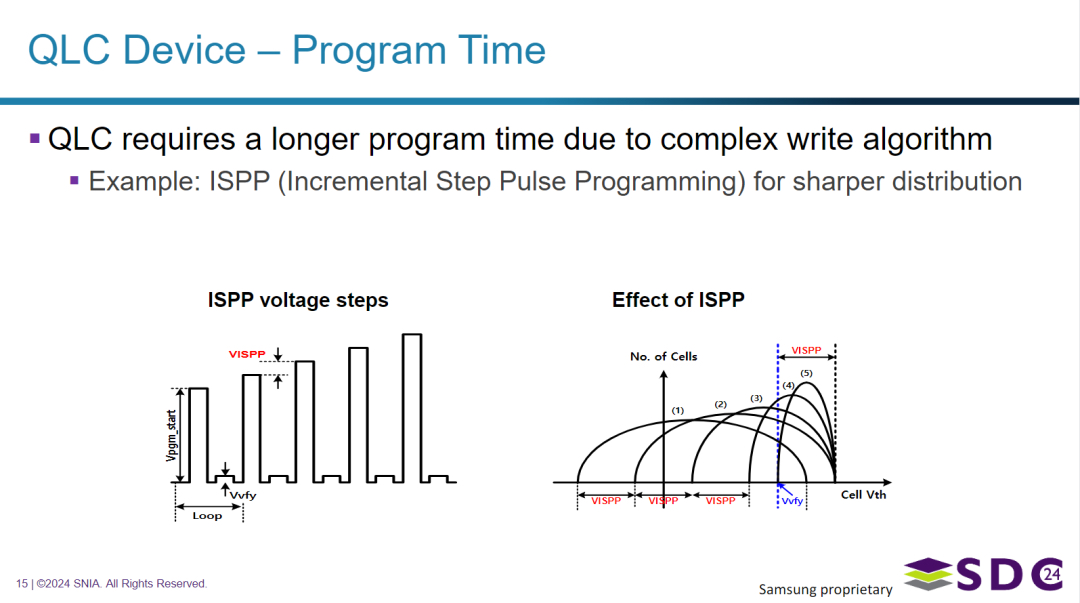
The picture explains why QLC SSD requires longer programming (write) time.
The picture points out that due to the need for complex write algorithms to accurately set multiple voltage levels in each unit, the programming time of QLC equipment will be longer. As an example, the picture shows the incremental step pulse programming (ISPP) technology. The diagram illustrates the working principle of ISPP: by applying a series of gradually increasing voltage pulses and verifying between cycles, the threshold voltage of the unit is gradually and accurately adjusted.. The "ISPP effect" chart intuitively shows how this process makes the voltage distribution curve sharper and clearer, which is crucial for Reliably distinguishing 16 voltage levels in QLC. This complex programming process directly leads to a longer write time for QLC compared to the technology with less bits per unit.

The image compares the key factors that affect the performance of high-capacity QLC SSDs and TLC SSDs.
The picture emphasizes that for high-capacity QLC SSD, the number of parallel channels (# of ways) and the AC parameters of NAND flash memory (such as Read time tR and programming time tPROG) are the main factors that determine the performance.
The table subdivides the performance factors of different operations (sequential read/write and random read/write): For sequential read, both are limited by the host interface bandwidth; For random read, QLC is mainly affected by the number of parallel channels and read time tR, and TLC is affected by tDMA. Both sequential and random writes are affected by the number of parallel channels and the programming time tPROG. tDMA is also listed by TLC. This shows that, optimizing the number of parallel channels and the read/write time series parameters inside NAND are crucial for improving the performance of high-capacity QLC SSDs, especially for random operations and writes..
Comparison of performance differences between QLC and TLC
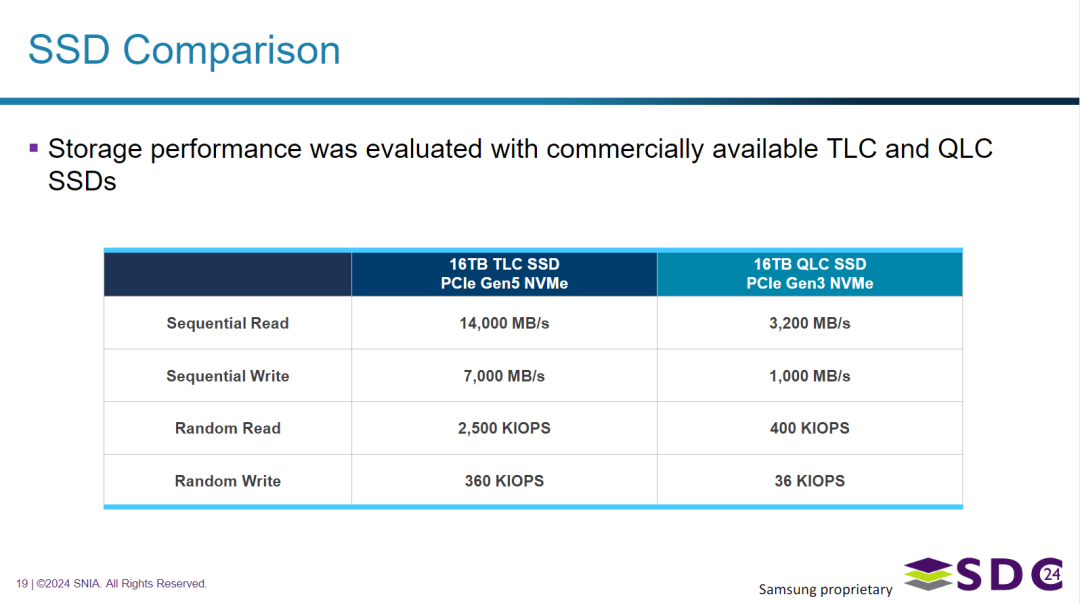
the picture compares the storage performance of the commercially available 16TB TLC SSD (using the PCIe Gen5 NVMe interface) and 16TB QLC SSD (using the PCIe Gen3 NVMe interface).
The table lists the performance metrics of sequential read/write and random read/write. Data shows that although the capacity is the same TLC SSD is significantly better than QLC SSD in all Test indexes, especially in sequential write, random read IOPS, and random write speed.. This reflects the inherent performance differences between TLC and QLC NAND flash memory, and is also affected by Interface intergeneration (PCIe Gen5 vs Gen3), especially in sequential read and write.
| 操作类型 | 16TB TLC SSD PCIe Gen5 NVMe | 16TB QLC SSD PCIe Gen3 NVMe |
|---|---|---|
| | | |
| | | |
| | | |
| | | |

The picture shows the analysis of storage performance cases in a large-scale parallel processing (MPP) database environment (Greenplum DB).
It compares three configurations using SATA SSD, TLC SSD (PCIe Gen5 NVMe) and QLC SSD (PCIe Gen3 NVMe). Analysis shows that the workload is mainly random read (accounting for 61% of the total I/O). A key finding is that although 30% performance degradation was observed when switching from the TLC configuration to the QLC configuration (although the capacity density of the two is similar to that of each node configuration), however, the performance of QLC configuration is 29% higher than that of typical SATA SSD devices. This indicates that compared with traditional SATA SSDs, QLC SSDs provide significant performance improvements for specific database workloads that are mainly based on random reads, even if its performance does not reach the level of high-end TLC PCIe Gen5 SSD. The bar chart in the figure intuitively supports these performance comparisons and shows the performance under different workload types. The table lists the system specifications of various configurations in detail.
the QLC performance of the query scenario is much higher than that of the SATA interface.
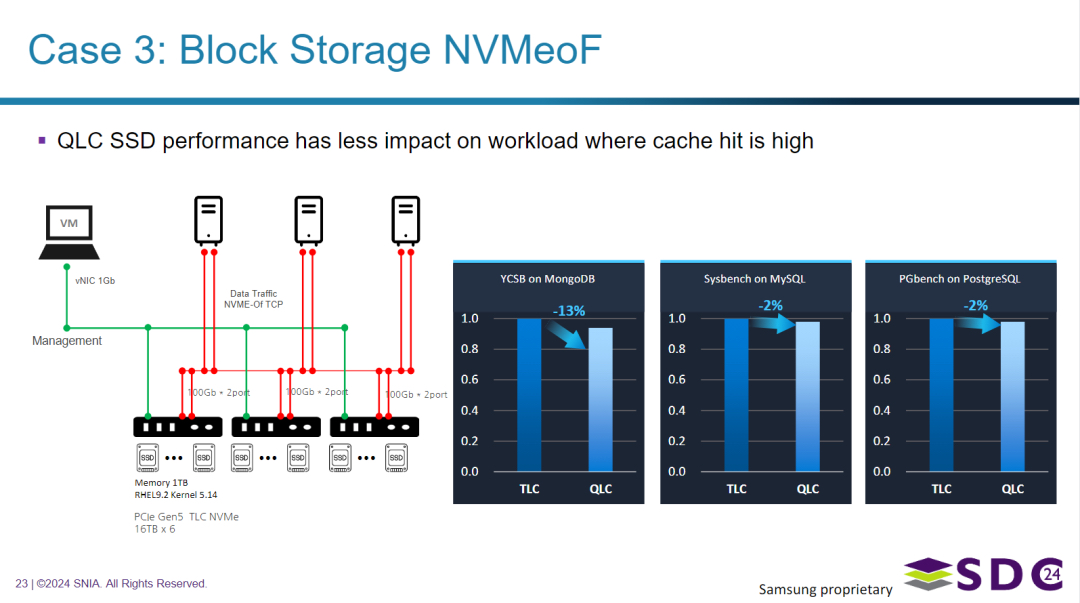
The image shows the block storage using NVMe-oF technology.
The chart shows a distributed storage architecture in which virtual machines are connected through the network. Use NVMe-oF TCP to access storage. The key points in the picture indicate that QLC SSD performance has little impact on workloads with high cache hit rate. This is supported by three bar charts, which compare the performance of TLC and QLC in different database benchmark tests (YCSB on MongoDB, Sysbench on MySQL, PGbench on PostgreSQL). In these cache-dependent workloads, the performance difference between TLC and QLC SSD is relatively small (MongoDB is -13%,MySQL and PostgreSQL are only -2%), which this indicates that when data is often provided from the cache rather than directly from the SSD, the inherent performance differences of the underlying NAND Technologies (QLC and TLC) become less significant.

the picture discusses the impact of QLC SSD storage on the availability service level agreement (SLA), especially the data refactoring time (for example, in RAID configurations).
The chart compares the theoretical reconstruction time of HDD, TLC SSD, and QLC SSD under different capacities. The diagram shows that although the reconstruction time of HDD increases significantly and is the slowest with capacity, the reconstruction time of QLC SSD is much lower than that of HDD, but it increases slightly with capacity, this is different from the situation where the TLC SSD remains basically unchanged. The text in the picture confirms that QLC refactoring time increases with capacity, but also points out that higher-performance QLC SSD can improve SLA. The chart intuitively supports the view that QLC reconstruction time is higher than TLC, but it is significantly better than HDD, and there is potential for improvement (indicated by arrows).
Although the features of QLC (such as slow write/refactoring) pose challenges to availability SLA, advances in QLC technology can help alleviate these problems.
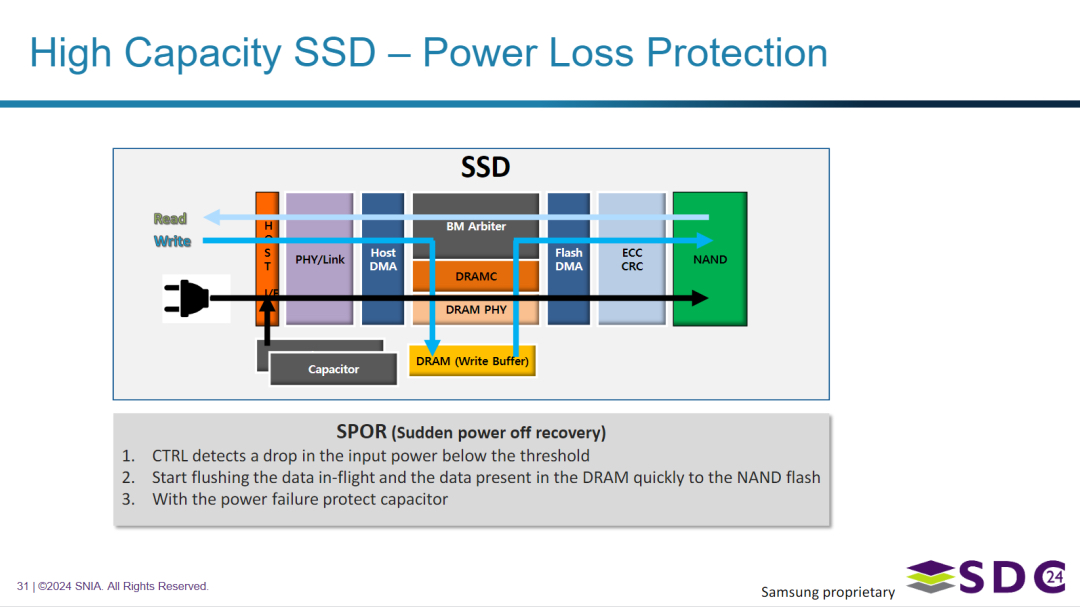
The picture explains the power-down protection mechanism in high-capacity SSDs, especially sudden power-down recovery (SPOR).
The chart shows the internal components involved in power-down protection, including power-down protection capacitors. The steps of SPOR are described as: firstly, the controller detects that the input power supply drops below the preset threshold; Secondly, it uses power-down to protect the energy stored in the capacitor, quickly write data being transmitted ("in-flight") and data stored in DRAM write cache to NAND flash memory. This step is essential to ensure data integrity and prevent data corruption in the event of an unexpected power outage.
the graphic structure is also helpful for understanding the data reading and writing process of SSD.
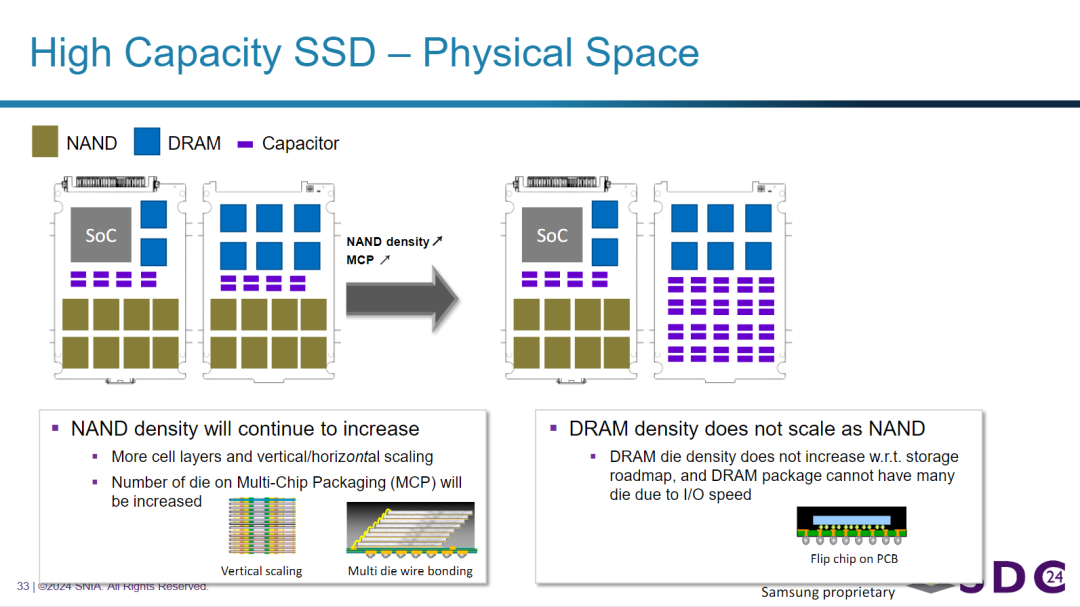
The differences in physical space and density expansion between NAND flash memory and DRAM in high-capacity SSD are discussed.
As shown in the figure, NAND density continues to increase significantly by increasing the number of unit layers (vertical expansion) and integrating more chips in a multi-chip package (MCP). It shows that in the same physical space, higher NAND capacity can be achieved through denser stacking. In contrast, the picture emphasizes that the density expansion speed of DRAM is not as fast as NAND, which is mainly due to the limitation of I/O speed and the difficulty of stacking a large number of DRAM chips in the package.
This explains why the relative usage of DRAM may not increase proportionally with the substantial increase of SSD capacity due to the progress of NAND technology, which may affect the performance characteristics of those highly dependent on DRAM cache. The diagram visually shows the increase in the ratio of NAND to DRAM in high-density SSD.
The key to understanding this trend lies in the "Power Loss Protection / SPOR" mechanism.
- Requirements for power failure protection:
high-capacity SSDs, especially those with DRAM cache, store some data or mapping tables to be written in high-speed DRAM during normal operation. If the power is suddenly cut off, the data in DRAM will be lost, resulting in data corruption or inconsistency. The power failure protection function (SPOR) is to use the electric energy stored in the capacitor to provide a short working time for the SSD controller when detecting the interruption of the external power supply, in order to quickly write key data in DRAM into secure NAND flash memory. - Increased capacity means more data needs to be protected:
with the increase of SSD capacity (implemented through higher-density NAND), the size of its internal DRAM cache usually increases, or the amount of data to be processed during write operations is larger. - Larger power reserves:
in order to have enough time and energy to successfully write these possibly more data from DRAM to a larger number of NAND chips with higher density when power failure occurs, more power reserves are needed. - Functions of Capacitors:
capacitors are the key components to provide such short-term power reserves. Increasing the number or total capacity of capacitors can provide longer power-down retention time and larger discharge energy, thus ensuring sufficient capacity to complete data flash memory operation during power-off.
Therefore, the significant increase in the number of capacitors in the figure on the right directly reflects that high-capacity SSD needs more power support in power-down protection to meet the data protection requirements brought by higher capacity and more complex write processes. This is a key design consideration to ensure that SSD data is not lost or damaged in case of sudden power failure.

The image proposes to use LBS as a solution to solve the service level agreement (SLA) challenge of high-density QLC SSD, aiming at improving sequential write and random read performance.
The diagram shows that, high-density NAND and possibly larger block sizes (LBS) can be used to reallocate space inside the SSD, especially to allocate space for more capacitors.(This is related to the power failure protection discussed earlier). The text below the figure emphasizes that although NAND manufacturers are developing high-density NAND, to effectively implement LBS, all links in the storage ecosystem (including SSD, storage software, operating system, platform and virtual machine monitoring program, etc.) cooperate at the industry level to establish a complete LBS ecosystem. This shows that to give full play to the advantages of high-density QLC (possibly through LBS), it is not only a SSD hardware problem, but also requires wider industry support to promote new block size standards or methods.
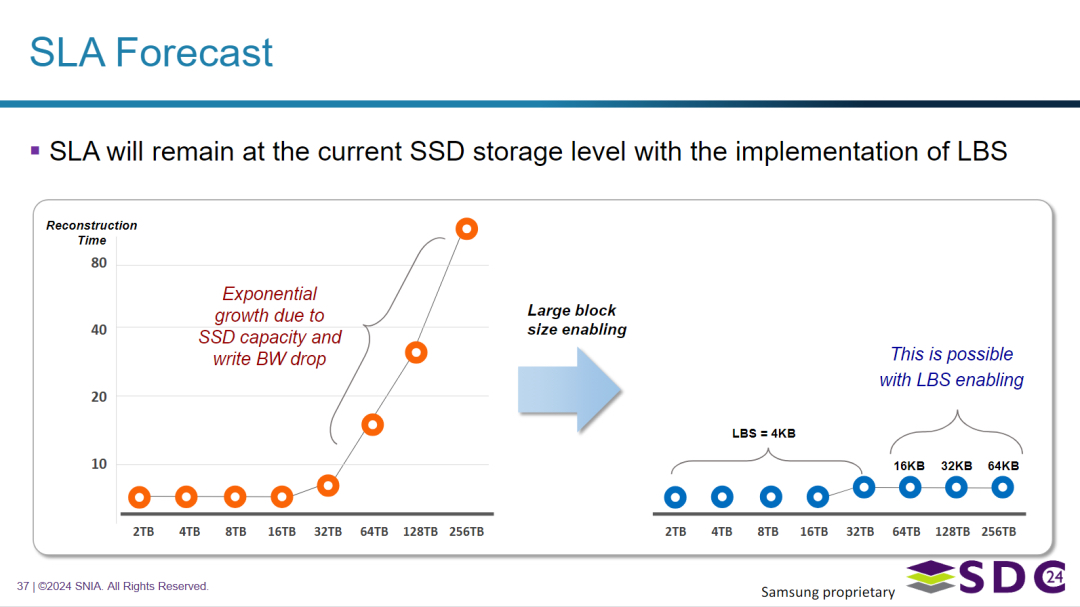
The image predicts the service level agreement (SLA), paying special attention to the impact of large block size (LBS) on the reconstruction time (critical to availability).
The chart shows an expected challenge: if LBS is not used, the reconstruction time is expected to increase exponentially with the increase of SSD capacity, which may be due to the high-density NAND characteristics and the possible decrease of effective write bandwidth after large scale.. However, the image predicts that by implementing and enabling LBS, the refactoring time can be maintained at a low level while the capacity increases, effectively maintaining the availability SLA of SSD storage at the current level. The chart visually compares the potential exponential growth trend with the ideal flat trend achieved through LBS. This strongly indicates that LBS is considered as a necessary technology to manage the SLA challenges posed by high-capacity SSDs in the future. The specific block sizes (4KB, 16KB, 32KB, 64KB) marked in the figure indicate the size of blocks considered or utilized in the LBS context.
• samsung: application ecology of big IU landing (LBS practice)
main content of the article
• LBS technical background: This article discusses in depth the challenges faced by SSD architecture design, especially the trade-off between logical block address (LBA) and internal Unit (IU) size matching. With the explosive growth of data, SSD performance optimization has become crucial. Industry leaders such as Samsung are actively exploring optimization solutions at the host operating system level, such as large block size (LBS) technology.
• LBS technology principle: LBS technology enables large block size at the host operating system level to better support QLC and SSD with large IU. The main advantage of this method is that it has the least impact on the existing host software ecosystem, and can make almost all host software "free" to obtain benefits.
• LBS technology advantages: LBS technology maintains backward compatibility and provides an option to allow I/O alignment certainty, you can use the sector size and align host I/O with atomicity. After using this method, QLC SSD has significant performance benefits in database workloads, including increased TPS and decreased variability.
• LBS technical challenges: The article also discusses the difficulties in increasing the size of LBA sectors, including extensive software ecosystem dependencies and legacy compatibility issues.
that's all for this sharing. Maybe the following questions can inspire you to think more. Welcome to leave a message and talk about your thoughts ~
-
in addition to LBS, what potential technological or architectural innovations in the future can further improve the performance and reliability of high-density QLC SSDs and make them more widely used in enterprise-level storage? -
Considering that QLC SSD performs well under specific workloads (such as high cache hit rate or read-based), in actual deployment, how to accurately select QLC or TLC SSD based on application scenarios to achieve the best balance between cost and performance? -
The promotion of LBS technology requires the cooperation of the entire ecosystem. What factors do you think are the main forces that drive or hinder the wide implementation of LBS?
原文标题:Impact of High Capacity and QLC SSD
Notice:Human's prompt, Datasets by Gemini-2.0-flash-thinking
Public number: wang Zhiyu, focusing on data storage, cloud computing trends and product solutions.
PPT from Samsung Semiconductor senior engineer Hyung-Seuk Kim, report materials at the SNIA Storage Developer Conference (24).